# Automating Kubernetes Observability: Scaling Your Metrics with Dynamic Discovery
Table of Contents
Let’s say you have a kubernetes cluster and prometheus with multiple workloads running on it. You want to monitor the health of the cluster and the workloads.
One of the pitfalls is you keep manually adding metrics to prometheus. This is a bad practice because it is not scalable and not maintainable.
Automated metrics collection is the right way to go. Leveraging Kubernetes Service Discovery(kubernetes_sd_configs). This allows Prometheus to query the Kubernetes API directly to find what needs to be scraped.
cAdvisor: Node-level metrics
1. Create a service account and a role binding to give the prometheus service account access to the cluster kubernetes api.
apiVersion: v1kind: ServiceAccountmetadata: name: prometheus namespace: monitoring---apiVersion: rbac.authorization.k8s.io/v1kind: ClusterRolemetadata: name: prometheus-readerrules: - apiGroups: [""] resources: - nodes - nodes/proxy - services - endpoints - pods - namespaces verbs: ["get", "list", "watch"]---apiVersion: rbac.authorization.k8s.io/v1kind: ClusterRoleBindingmetadata: name: prometheus-reader-bindingroleRef: apiGroup: rbac.authorization.k8s.io kind: ClusterRole name: prometheus-readersubjects: - kind: ServiceAccount name: prometheus namespace: monitoring# Allow Prometheus to scrape the Kubernetes API.2. Configure Prometheus to scrape the Kubernetes API.
global:  scrape_interval: 15s  evaluation_interval: 15s
scrape_configs:# 1. Automate Node-level metrics (cAdvisor)  - job_name: "kubernetes-kubelet"    scheme: https    tls_config:      insecure_skip_verify: true
    kubernetes_sd_configs:      - role: node
    bearer_token_file: /var/run/secrets/kubernetes.io/serviceaccount/token
    relabel_configs:      - action: labelmap        regex: __meta_kubernetes_node_label_(.+)
      - target_label: __address__        replacement: kubernetes.default.svc:443
      - source_labels: [__meta_kubernetes_node_name]        target_label: __metrics_path__        replacement: /api/v1/nodes/$1/proxy/metrics/cadvisor
Now you would get most CPU, memory, disk, network, and other node-level physical metrics automatically.
And don’t forget kube-state-metrics. these are higher level metrics that binds the low level physical metrics to the kubernetes objects. Which will answer your questions like: what pod crashed, how many times, what service is down, what node is under pressure, etc. https://github.com/prometheus-community/helm-charts/tree/main/charts/kube-state-metrics
Visualizing Kubernetes Metrics
Now after you get cAdvisor and kube-state-metrics metrics, you can visualize them in grafana or other visualization tools. You can create your own dashboards or just use the ones provided by the community.
For grafana: https://grafana.com/grafana/dashboards/15661-k8s-dashboard-en-20250125/
Service Discovery: Application-level metrics
1. Add this job to automate service discovery and scrape metrics from Applications
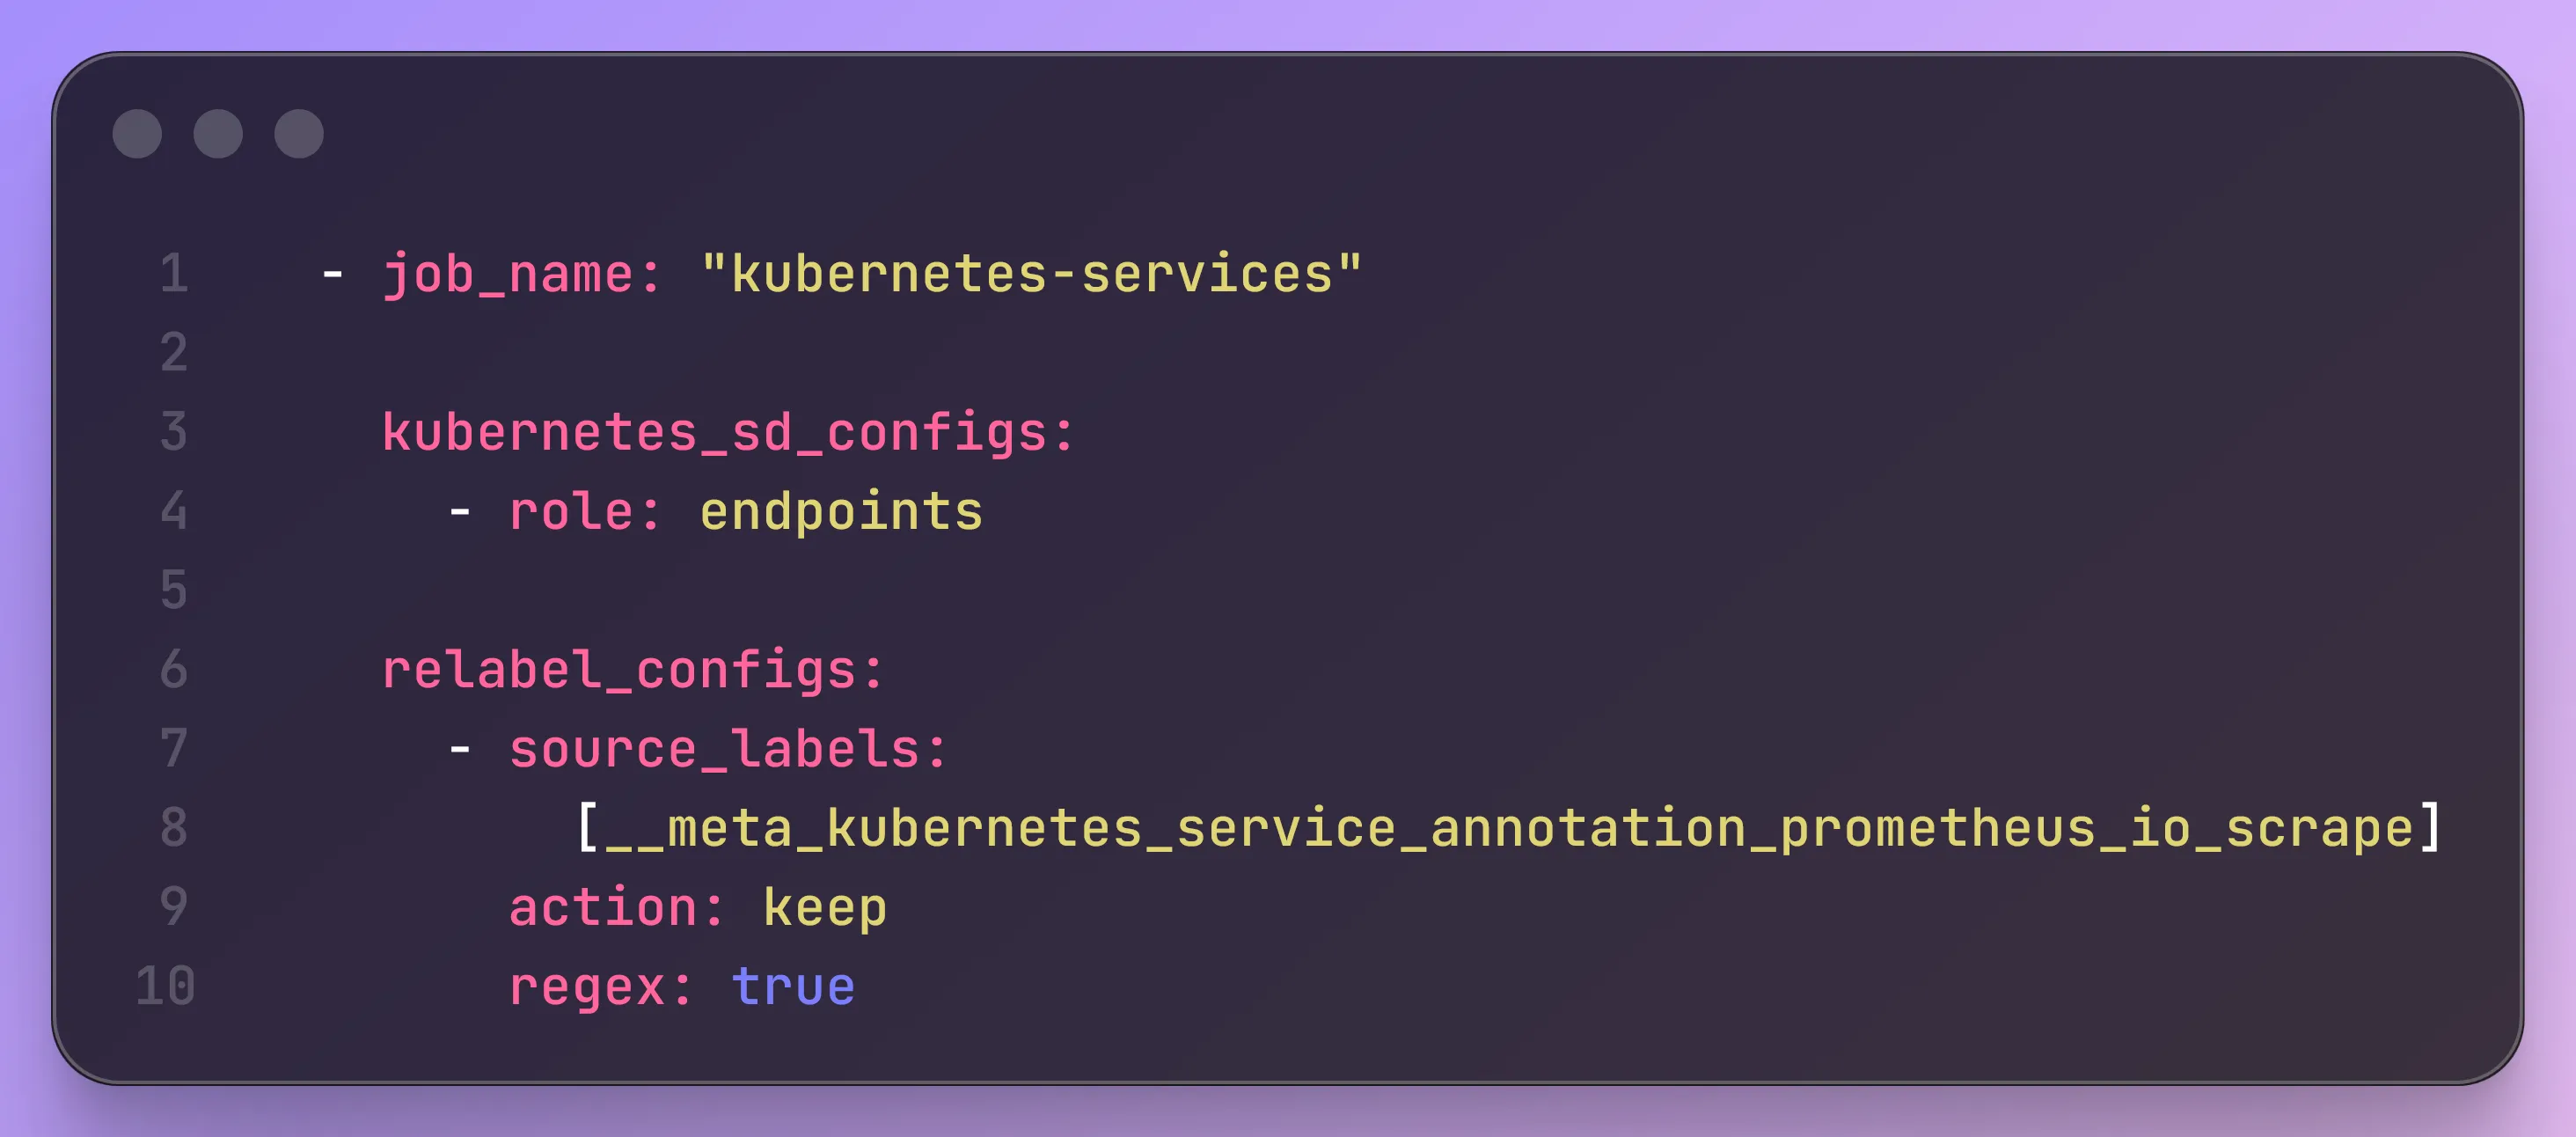
# 2. Automate Application-level metrics  - job_name: "kubernetes-services"
    kubernetes_sd_configs:      - role: endpoints
    relabel_configs:      - source_labels:          [__meta_kubernetes_service_annotation_prometheus_io_scrape]        action: keep        regex: true
2. Annotate the services that expose /metrics endpoint.
Now on each service you would need to add the following annotation to the services that expose /metrics endpoint. Wow.. now you never need to manually add metrics scrape job to prometheus ever again in this lifetime.
prometheus.io/scrape: "true"Modern Apps: OTLP/OpenTelemetry
But for apps that already use OTLP/OpenTelemetry, you don’t need to do this. If you use collector like otel-collector, grafana/alloy-collector and write the metrics to prometheus. Then you would already be able to explore metrics in grafana or other visualization tools.